SKIP AHEAD TO
Introduction
Step-By-Step Instructions
Introduction
When testing an App in Preview, a general 'Could not retrieve next page' error message appears if a part of the App is misconfigured.
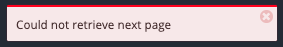
Figure 1: General error message for Checkbox apps
The specific error behind each general error message can be identified through the Network tab in Google Chrome's developer interface.
Step-By-Step Instructions
To identify specific causes of App errors:
- Right click on your web page, then select Inspect.
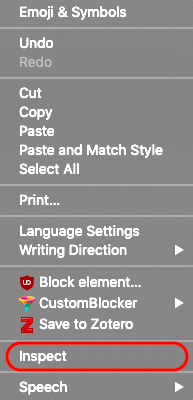
Figure 2: Location of Inspect on right click menu - Click Network in the developer interface taskbar.

Figure 3: Location of Network on developer interface taskbar - Open the page where the error takes place in Preview and click next to execute the error. Content will then appear in the Network tab of the developer interface.

Figure 4: The page in this example where, if Next is clicked, an error is encountered. - In the Network tab, click on the line highlighted in red that appears. A line of code will then appear on the right.
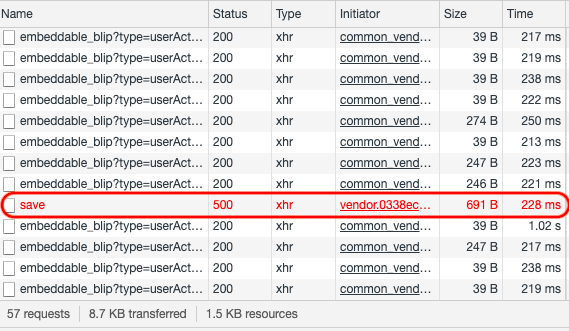
Figure 5: The relevant entry in the Network tab is highlighted in red - In the line of code, scroll right until you can see the description of the specific error.
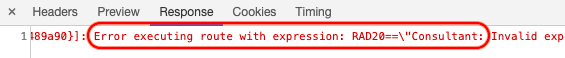
Figure 6: The location of the specific error description in the Network tab